Schema
Schema Stock Surveyor

Project Brief
The Schema Stock Surveyor is an internal spatial computing project utilizing Apple's Vision Pro.
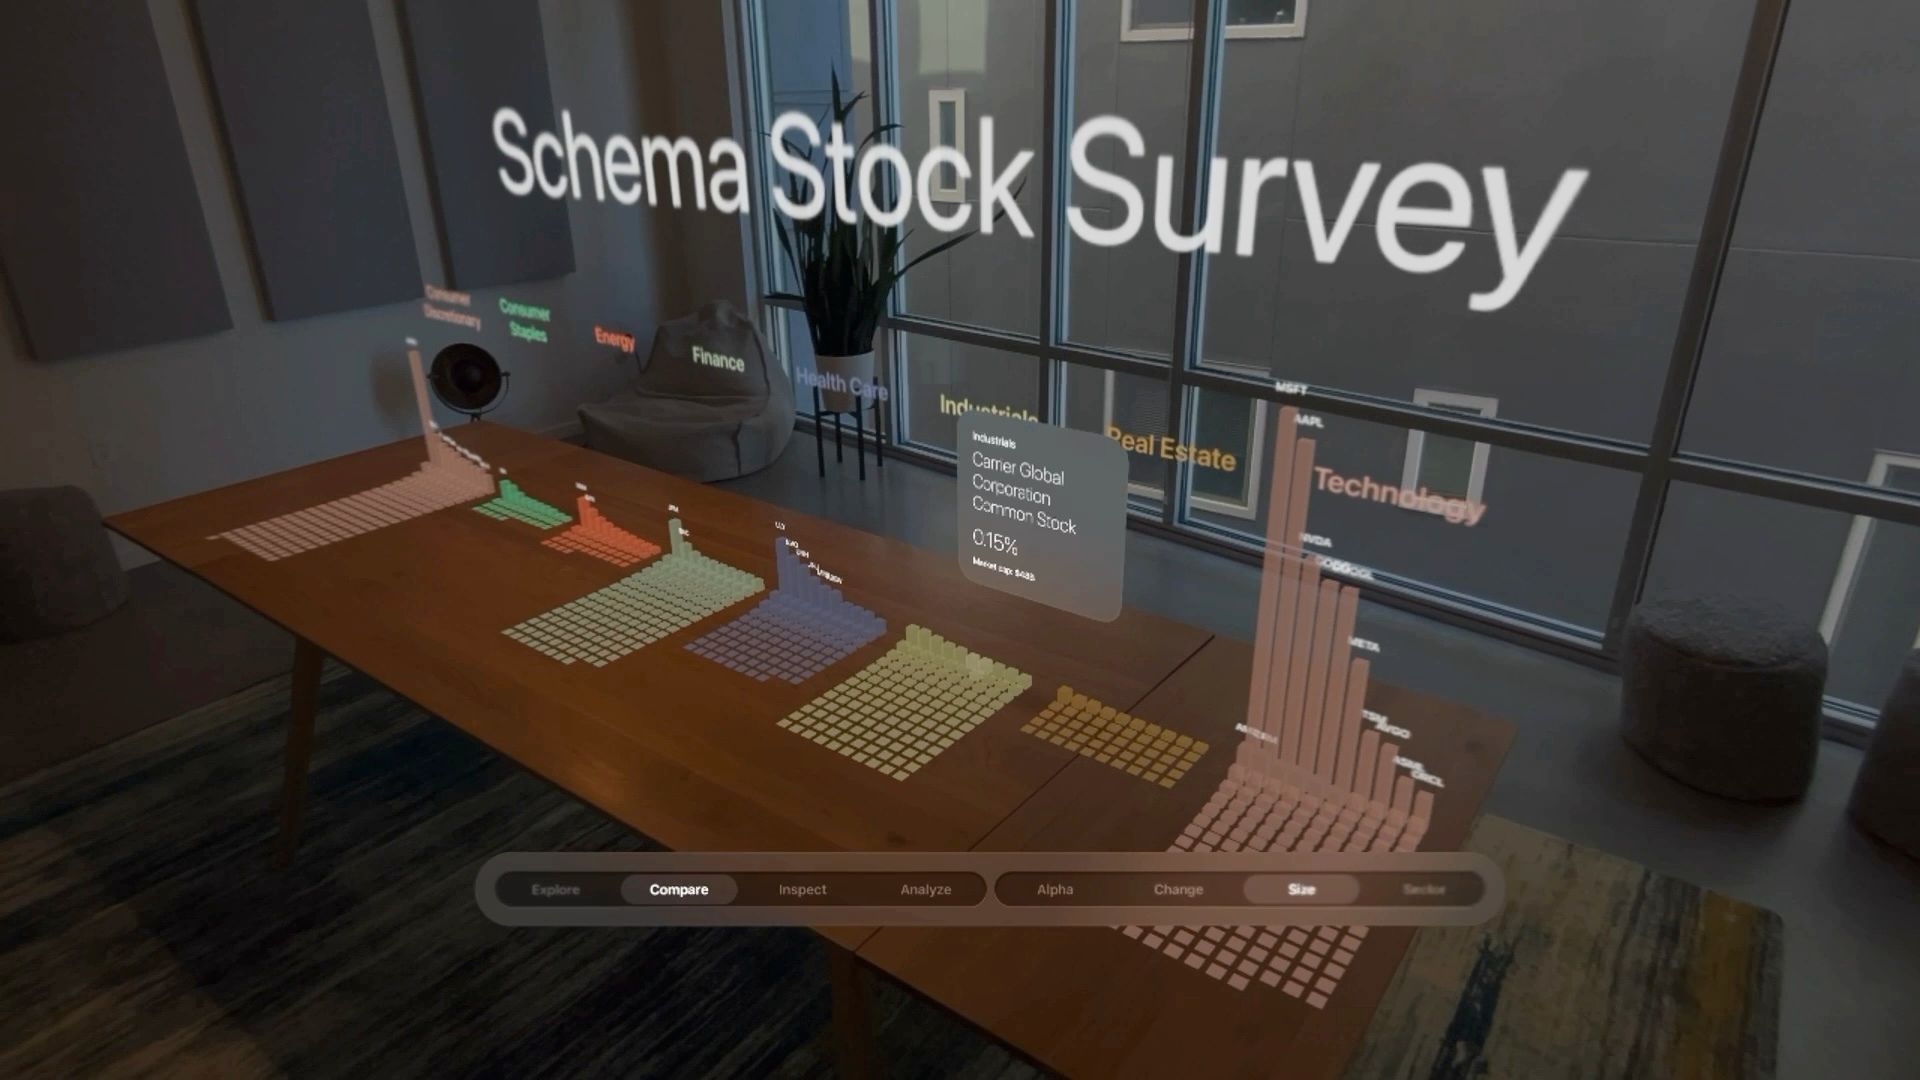
We've developed an immersive data visualization that brings the stock market to life, allowing users to effortlessly navigate through hundreds of stock values, all laid out as if they were physically present on a table before you. While the visualization is shown here on our eight-foot conference table, it could run equally well on a normal office desk or even an airplane folding table.
Stocks are neatly categorized into eight sectors, with the flexibility to sort them in various ways — by alphabetical order, by current value, or by change over the previous day. We will also soon be implementing historical data, so the user will be able to select any stock and quickly see how it has changed over time. One of the standout features of the Vision Pro is its precision in identifying exactly where you are looking. Going into this, we weren’t sure if the user would be able to select one of the 500+ stocks with their eyes alone, but it turns out the Vision Pro was able to do this consistently and with a high degree of accuracy. Beyond just a tool for individual use, we also envision this as a social experience, enabling multiple people to engage with the stock data in real time, pointing out trends and discussing insights right before their eyes.